For Leveraged ETFs, the Underlying Matters More Than the Leverage
If you're shopping for a leveraged ETF and want to control drawdown risk, the standard advice is to pick a lower-leverage product. 2x instead of 3x. QLD instead of TQQQ. The intuition feels right: less leverage, less damage when things go wrong.
That intuition is correct in isolation. It's wrong as a cross-product comparison. The data says that 3x leverage on a tamer underlying beats 2x leverage on a wilder one — by a meaningful margin, on both CAGR and max drawdown — and the difference comes from a place most retail traders don't consider: the underlying's bear-market profile, not its volatility profile.
Specifically: UPRO (3x SPY) with the SMA200 filter beats QLD (2x QQQ) with the same filter on both axes over 27 years. Higher CAGR. Lower max drawdown. Same filter, different underlying. The underlying's behavior in tail bears does more work than the leverage level does.
The data
Same harness, same window, same SMA200 rule. The only thing that changes is which underlying the synthetic LETF is built from.
| Strategy (1999-2026, with SMA200 filter + borrow cost) | CAGR | Max DD |
|---|---|---|
| UPRO + SMA200 (3x SPY) | 11.43% | -67.21% |
| TQQQ + SMA200 (3x QQQ) | 11.22% | -95.40% |
| QLD + SMA200 (2x QQQ) | 10.72% | -85.24% |
| SOXL + SMA200 (3x SOX) | 5.91% | -99.13% |
Visual:
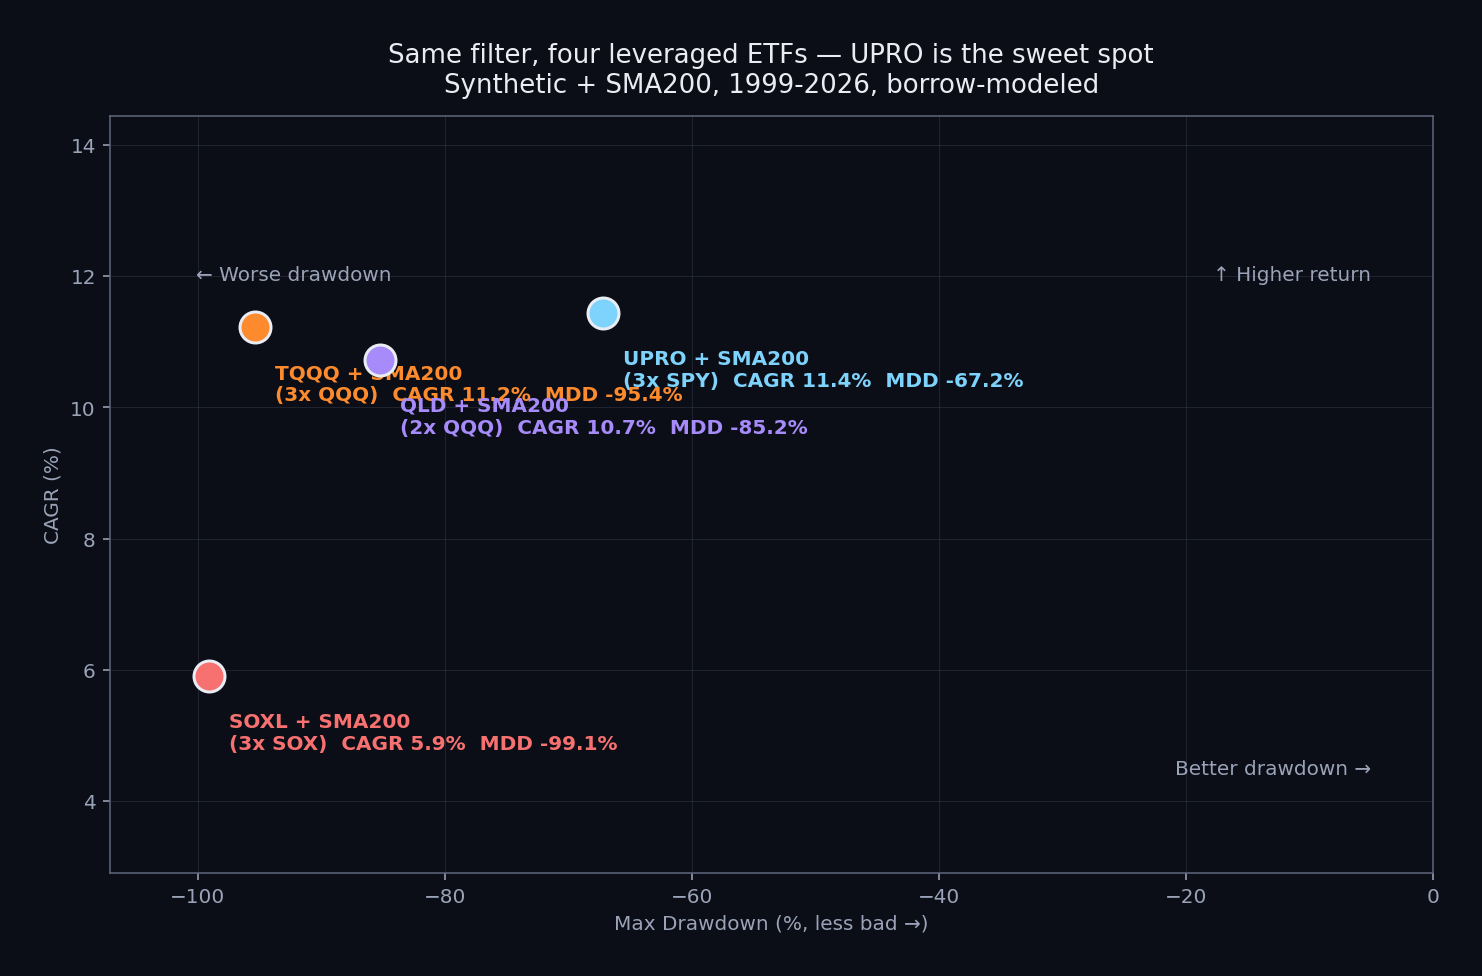
UPRO sits alone in the upper-right quadrant. It has the highest CAGR (11.43%) AND the least bad drawdown (-67%). On every metric a long-term holder cares about, it's strictly better than the QQQ-based or SOX-based alternatives over this window.
QLD — the 2x QQQ product that "less leverage" intuition would push you toward — finishes third. Lower CAGR than UPRO (10.72% vs 11.43%) AND worse drawdown (-85% vs -67%). The leverage reduction didn't help because the underlying was still the same QQQ that had a brutal dotcom bear.
Why this happens
The mechanism is the underlying's bear-market shape, not its day-to-day volatility.
SPY's dotcom drawdown was about -50%. QQQ's was about -83%. Same calendar window, dramatically different drawdown depths because QQQ was concentrated in the bubble while SPY was diversified across the broader market.
On 3x leverage, a -50% underlying drop compounds badly but stays in the recoverable range. The SMA200 filter eventually exits, the position bottoms out somewhere around -65% to -70%, and the recovery starts when the underlying re-enters the trend.
On 2x leverage, a -83% underlying drop compounds even worse than it would have on 1x, because vol decay during the multi-year crawl with whipsaws accumulates. The filter exits — but the filter exits at 15-25% off the underlying high, which is 30-50% off the leveraged version's high. By the time you're flat, you're already 30-50% underwater. Then you have to recover from there.
Two effects stack:
-
Vol decay accumulates during the multi-year bear, not just the crash itself. The 2000-2002 dotcom wasn't a single crash; it was a 2.5-year crawl with multiple violent rallies that pulled the SMA filter back into long positions briefly, then crashed again. Each cycle compounds losses on a leveraged product.
-
Recovery time is non-linear in leverage. A 2x product down -85% needs to gain 567% to recover. A 3x product down -67% needs to gain 203% to recover. The "lower leverage" position is in a much deeper hole even though it has more "headroom" in theory.
The QLD vs UPRO comparison is the cleanest test of "underlying vs leverage" because everything else (filter, window, costs) is identical. The result: QLD loses on both axes.
The terminal-wealth paradox
Here's the strangest part of the data, and worth flagging because it complicates the conclusion:
UPRO + SMA200 ends at ~$19 per $1 invested over 27 years. TQQQ + SMA200 ends at ~$18. Different paths, almost identical destinations.
How? Because the higher-vol underlying produces deeper drawdowns AND bigger recoveries on the same long-run compound rate. They roughly cancel out at terminal wealth. The CAGR difference between UPRO (11.43%) and TQQQ (11.22%) is statistically tiny.
So if you take a purely terminal-wealth view, the TQQQ vs UPRO choice is a wash. If you take a path view, UPRO is dramatically better. The -95% drawdown along the way is the difference.
This matters because most humans don't have infinite holding capacity. Backtests assume you stay in the position through any drawdown. In practice, most people sell at -80% on a 3x leveraged ETF — they panic, they need the money, they lose their job, they get a divorce. The -95% TQQQ + filter strategy isn't a strategy most actual humans can execute. The -67% UPRO + filter strategy is.
So the path matters because you matter, not because terminal wealth differs much. For someone with infinite patience, no liquidity needs, and the emotional control of a backtesting robot, TQQQ + filter is mathematically equivalent to UPRO + filter. That's not most of us. The -67% drawdown is the strategy you can actually execute through a full cycle without breaking. The -95% is the strategy that destroys most real portfolios.
The framework
If you're choosing between leveraged ETFs and care about long-run risk-adjusted return rather than headline leverage, the actionable framework is:
Step 1: pick the underlying based on tail-bear stomach.
How rough are the underlying's historical bears? SPY's worst is around -50% (dotcom, GFC). QQQ's worst is -83% (dotcom). ^SOX's worst is roughly -85% (dotcom) with structurally higher volatility throughout. Russell 2000 (IWM) sits between SPY and QQQ. Pick the underlying whose bear-market shape you can absorb on leverage.
Step 2: size leverage to your stomach.
For SPY-based exposure, 3x (UPRO) works with the filter on. For QQQ-based exposure, 3x (TQQQ) is borderline; 2x (QLD) is worse than expected because QQQ's bear shape eats the leverage savings. For SOX-based exposure, even 2x is structurally questionable; see The Semi Collapse Scenario for why.
Step 3: don't try to outsmart the framework with confluence indicators.
The data on multi-indicator confluence is brutal — most "tuned" stacks fail walk-forward. See Why One Indicator Isn't Enough for the evidence. The single-SMA200 filter on the right underlying does more for you than three carefully tuned indicators on the wrong one.
What this changes for portfolio construction
Three practical reads if you're already running an SMA200 + leveraged-equity strategy:
1. If you're in TQQQ, the SPY-based equivalent is structurally better. UPRO has nearly identical CAGR with dramatically lower max drawdown. The marginal upside on a few specific bull years (TQQQ outpaces UPRO in straight Nasdaq runs like 2017, 2023) costs you 28 percentage points of max drawdown in exchange. Most allocators will take the deal.
2. If you're in QLD, the case for downshifting to 2x QQQ specifically is weak. It doesn't actually solve the underlying problem (QQQ's bear shape) — it just gives you less upside without proportionally less downside. UPRO is the better Sharpe + drawdown profile.
3. If you're in SOXL, the math is genuinely against you over multi-decade windows. See the vol break-point research for the structural argument: 3x leverage breaks above ~25-30% underlying vol, and ^SOX is at ~37%. The SMA200 alone doesn't save it.
None of this is allocation advice. It's research output for the kind of person already running a trend-filter strategy who is wondering which leveraged ETF to pick. The actual sizing decision depends on your account type, tax situation, time horizon, and emotional capacity for path-pain.
Caveats
- 27-year window, dotcom dominates the bear story. A regime without a dotcom-style 80%+ tech crash would compress the QQQ vs SPY gap meaningfully. The next 27 years may not include another bear that deep.
- Borrow cost modeled at ^IRX + 40bps (Testfolio-compatible). See the methodology article for what changes if you don't model it.
- All four strategies have multi-year drawdown periods. Even UPRO's -67% takes years to recover. None of this is "easy."
- Past performance is not predictive. Especially for leveraged products in regime changes.
Source research
- Leverage vs Volatility per Underlying — the per-underlying methodology that established the vol break-point finding
- Full Leverage Spectrum — 1x/2x/3x across 5 underlyings showing where leverage stops adding value
- Borrow-Cost Correction: Synthetic LETF Methodology — the harness powering these numbers
Reproducibility: pip install sma200-bt + yfinance. All numbers verifiable in ~20 lines of Python.
Related articles
- The Semi Collapse Scenario — what happens if semis have their own dotcom; the dramatic version of the same finding applied to SOXL specifically
- The Hidden Cost Every Leveraged-ETF Backtest Ignores — the methodology foundation; why every synthetic LETF backtest needs borrow modeling
- The Third Defensive Bucket: Managed Futures — what to hold when the filter says "go flat"
- Does the 200-day Moving Average Actually Beat Buy-and-Hold? — the foundational case for the filter
Check current SMA200 status: UPRO, TQQQ, QLD, SOXL, SPY, QQQ.
For the broker side of leveraged ETF execution, see the broker shortlist.