The Hidden Cost Every Leveraged-ETF Backtest Ignores
A few days ago I posted a comment on r/LETFs with synthetic TQQQ numbers going back to 1999. The numbers were directionally right but absolutely wrong. They overstated buy-and-hold returns by 60% over the past 10 years and overstated the SMA200 filter's Sharpe advantage by a factor of seven.
A commenter asked the obvious question: "does this match Testfolio?" That's when I checked. It didn't, by a lot. This article is the correction, the calibration proof, and the cleaner story that the corrected numbers actually tell.
The bug, in one formula
The standard back-extension approach for synthetic leveraged ETFs is to take the underlying's daily returns and apply the leverage:
daily_return = L × underlying_return − ER / 252
That's what many one-off "what would TQQQ have done in 1999?" backtests use when people roll their own — Reddit threads, blog notebooks, scripts. Testfolio (the canonical reference, which I've used for years) gets it right. My own internal harness for the sma200.trade research didn't, because I built it from scratch instead of reconciling against Testfolio's methodology. The bug was in my code, not in the field's collective understanding. It's missing the third term that real leveraged ETFs pay every single day:
daily_return = L × underlying_return
             − ER / 252
             − (L − 1) × borrow_rate / 252
Mechanically, a 3x ETF holds $300 of underlying exposure for every $100 of investor capital. That extra $200 is financed through swap contracts, and the swap counterparty charges interest. For ProShares' 3x funds the financing rate runs roughly the effective Fed Funds rate plus a 30 to 50 basis point spread.
When short rates are zero (as they were for most of 2009 through 2021), the missing term is basically zero and the simple formula works fine. But when rates are anywhere meaningful, the simple formula starts overstating returns dramatically. At 5% T-bill rates a 3x fund pays roughly 2 × 5% = 10% per year in financing cost that the simple formula ignores. Over a decade, that compounds into a huge gap.
The calibration: real TQQQ vs both formulas
The cleanest test is to take the formula and apply it to real data over a window where the actual fund exists. Here are real TQQQ, simple-formula synthetic TQQQ, and the borrow-modeled synthetic TQQQ (using ^IRX for the daily T-bill rate plus a 40bps spread) over 2015-01-05 to 2024-12-31:
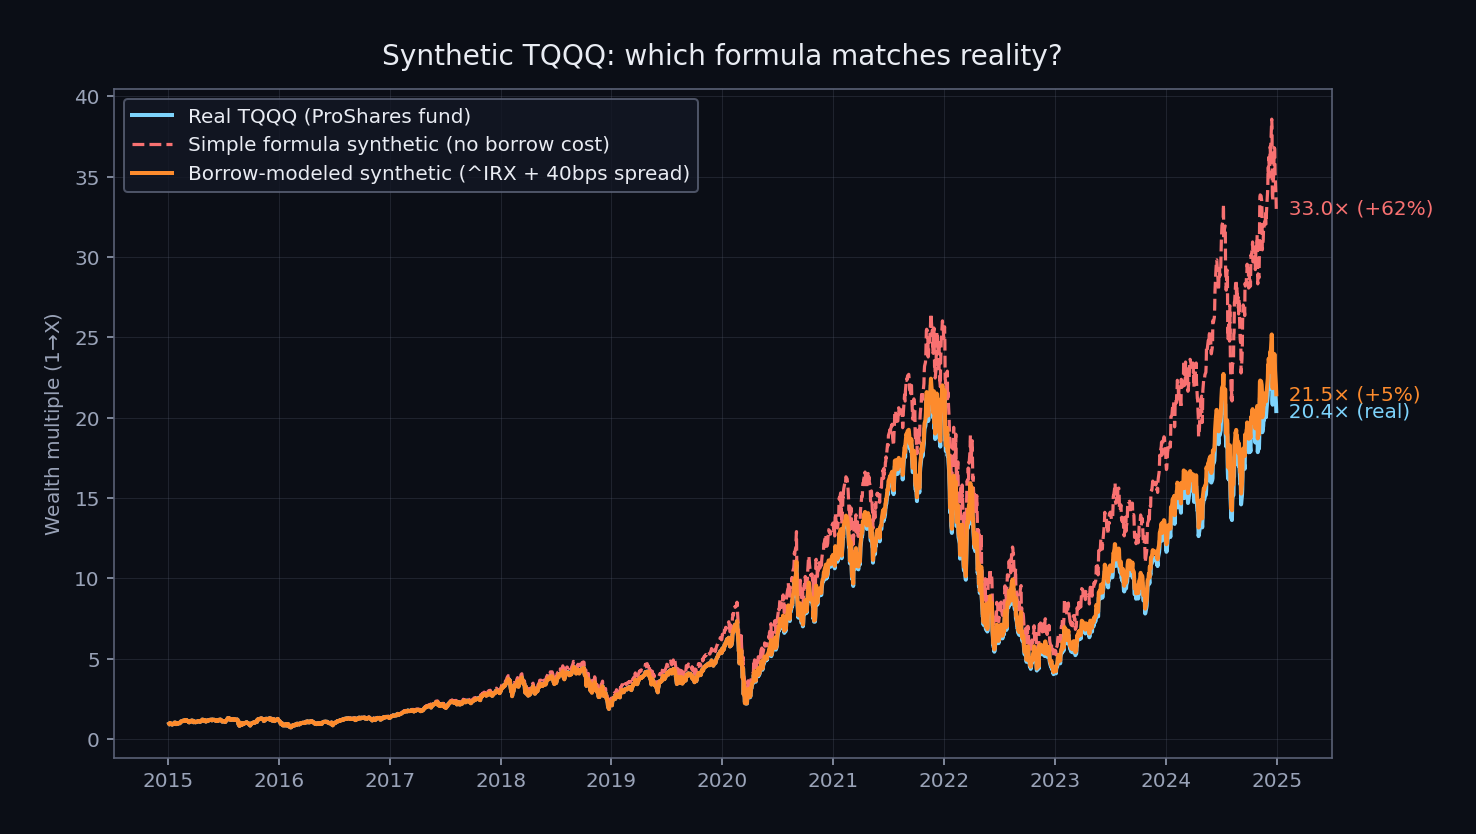
Final wealth multiples:
- Real TQQQ (ProShares fund): 20.4×
- Simple-formula synthetic: 33.0× (+62% overshoot vs real)
- Borrow-modeled synthetic: 21.5× (+5% drift vs real)
The simple formula overshoots the real fund by 62%. The borrow-modeled formula tracks within 5%, and that residual gap is plausibly tracking error plus the 40bps spread assumption being a midpoint estimate of ProShares' actual swap pricing. Both fall well within the noise band for research purposes.
This is exactly what Testfolio does. The reason Testfolio is the trusted backtesting reference in the leveraged-ETF community is that it implements the full formula, including the financing cost. Anyone running synthetic LETF numbers without modeling borrow cost is producing a number that does not match what the actual fund would have done.
What this changes for the 27-year synthetic TQQQ
Run the corrected formula over the full available history (QQQ inception March 1999 through May 2026, 27.2 years) and the synthetic TQQQ story is much less impressive than what I had originally posted:
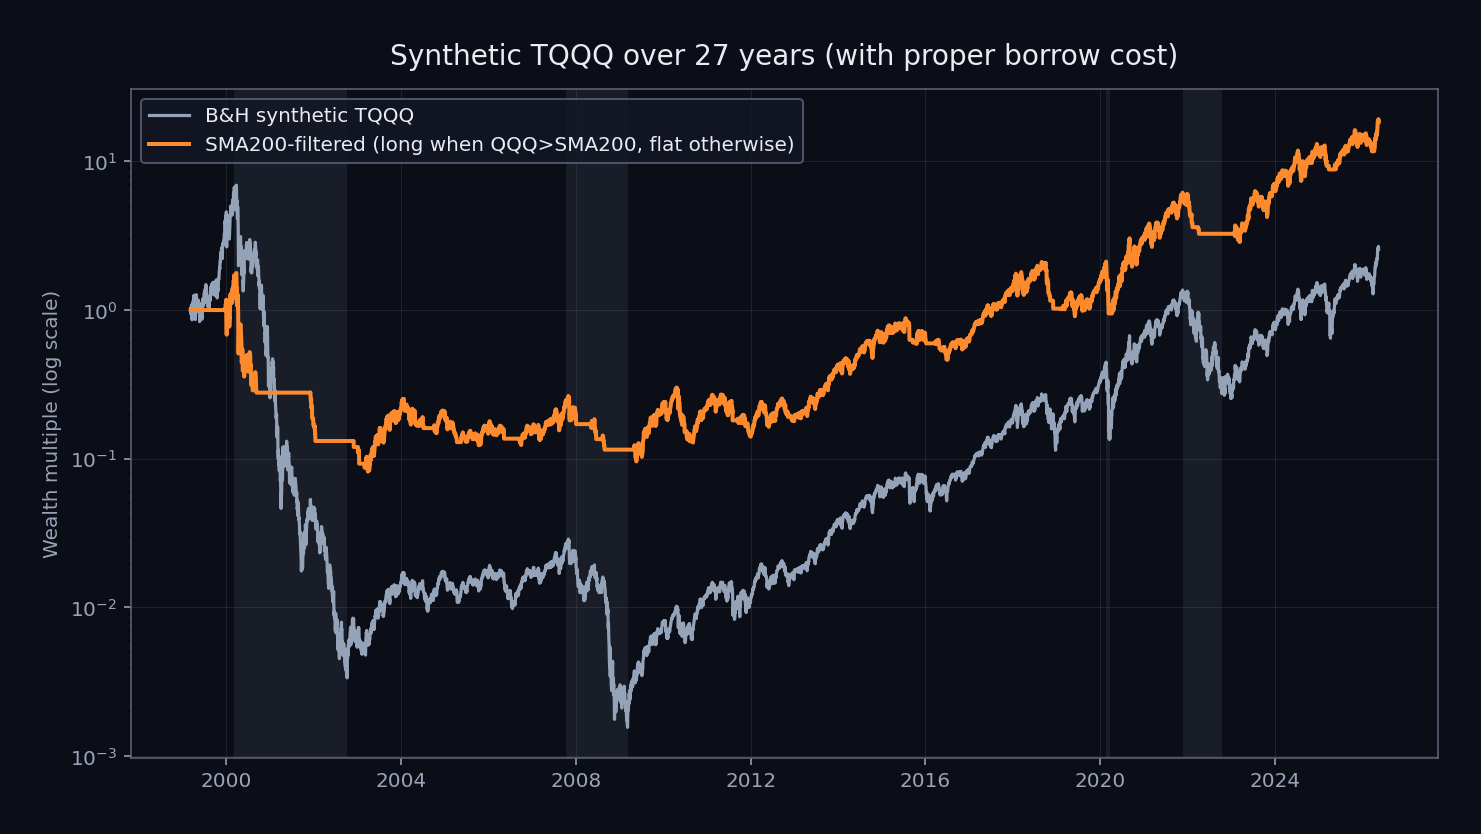
Buy-and-hold synthetic TQQQ from 1999 with proper borrow cost ends at 2.6× on $1, which is a 3.52% CAGR over 27 years. The dotcom bust draws it down 99.98%. It takes 25 years to recover the 2000 peak. By comparison, plain QQQ over the same window returned roughly 11% CAGR. The 3x leveraged version, properly costed, underperforms the underlying by a wide margin.
The SMA200-filtered version is meaningfully better. It compounds at 11.30% CAGR, ends at 18.3× on $1, and reduces the worst drawdown from 99.98% to 95.39%. But the Sharpe difference between the two is only +0.019, basically nothing.
The original Reddit comment I posted had this same headline number at +0.141. The +0.122 gap between the two is entirely the borrow-cost correction. It is also the difference between "the SMA200 filter dramatically rescues leveraged ETFs" and "the SMA200 filter modestly reduces the catastrophic drawdown on a still-losing-money position." Both might be true. Only one of them is interesting.
The cleaner story the corrected numbers tell
Here is where the article gets interesting, and where the original Reddit conclusion was actually a worse version of the real finding.
The Sharpe diff of +0.019 on pure synthetic TQQQ tells you that the SMA200 filter does not save a 100% leveraged equity position. The filter sidesteps drawdowns, which is good, but during the LONG periods you are still paying full borrow cost on the leveraged exposure. The drag is biggest in the high-rate regimes (1970s, early 2000s, 2022 onward) which are also when equity tends to be choppy. The filter cannot save you from financing costs that compound while you are correctly positioned long.
But that is the wrong portfolio to be running anyway. Nobody putting real money to work holds 100% TQQQ. The interesting question is what the filter does inside a portfolio with a defensive allocation, where the filter routes the equity sleeve to something productive during OFF periods instead of leaving it as a 100% drag.
Here is the same SMA200 filter applied to a sweep of UPRO (3x SPY synthetic, borrow-modeled) and UGL (2x gold, borrow-modeled) portfolios, holding the UPRO sleeve to cash when SPY is below its 200-day SMA, leaving the UGL sleeve unfiltered:
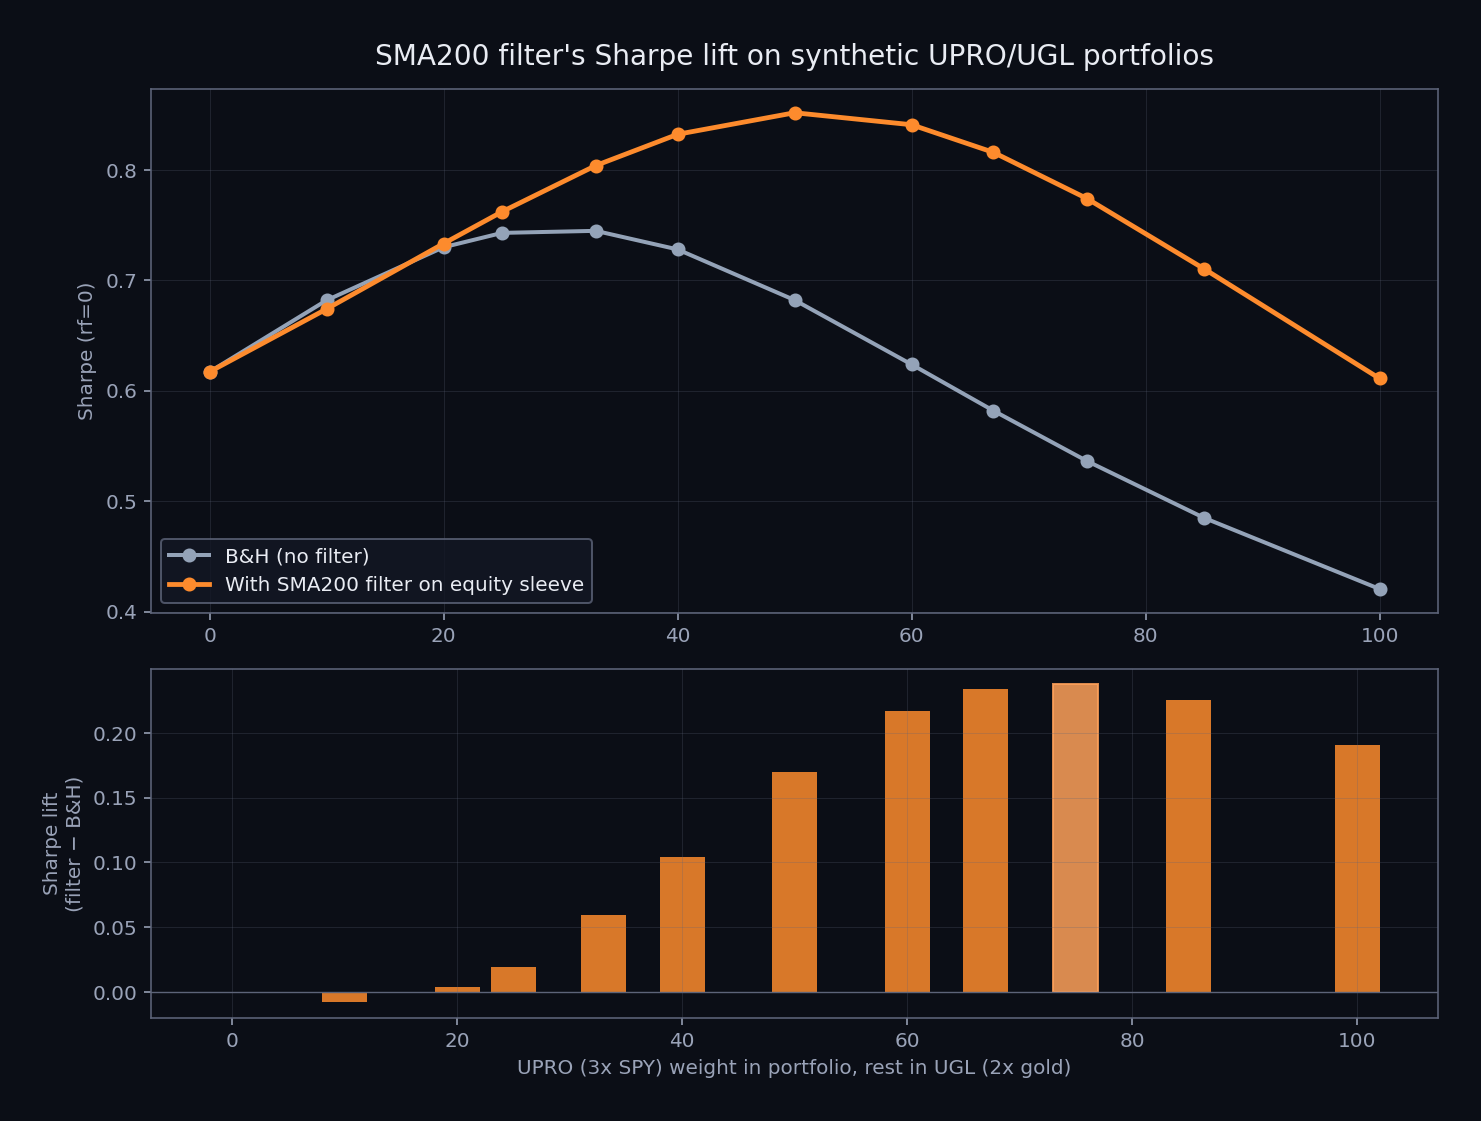
The top panel shows Sharpe with and without the filter, across UPRO weights from 0% (100% UGL) to 100% (pure synthetic UPRO, no defensive). The bottom panel shows the Sharpe lift, defined as filter Sharpe minus B&H Sharpe.
Three observations from this sweep, over the same 25.7-year window:
The filter helps most on the most equity-heavy portfolios. At 75% UPRO / 25% UGL it adds +0.238 Sharpe, lifting from 0.536 to 0.774. That is a substantial improvement. At 25% UPRO / 75% UGL it adds only +0.019, basically nothing. The filter's value scales with how much equity-vol-decay risk it has to neutralize.
The filter shifts the Sharpe-optimal portfolio composition. Without the filter, the best UPRO/UGL Sharpe is at 33/67 (Sharpe 0.745). With the filter, the best is at around 50/50 (Sharpe 0.852). The filter lets you safely hold more equity than you otherwise should because the catastrophic drawdowns get truncated.
Pure leveraged equity is still bad even with the filter. 100% UPRO with the filter gets Sharpe 0.611. Pure UGL with no filter gets 0.617. Heavy gold without a filter is competitive with maximum-leveraged equity even when you give the leveraged version every advantage. This is the durable finding that the May 14 numbers also showed, just with too-high absolute Sharpe levels.
The right way to frame what the SMA200 filter does
The Reddit and Bogleheads framing that gets repeated is some version of "does SMA200 save TQQQ buy-and-hold?" That question has a defensible answer (mostly no, with a small drawdown benefit) but it is the wrong question because nobody should be running 100% TQQQ buy-and-hold in the first place.
The better framing, supported by the corrected numbers, is that the SMA200 filter is a portfolio-construction tool that lets you hold a heavier equity allocation than you otherwise could without the catastrophic-tail risk eating the whole thing. Heavy gold base, equity sleeve filtered on SMA200, no long bonds (the defensive-bucket research shows long Treasuries actually hurt). That composition over 25.7 years produces Sharpe 0.85 with -33% max drawdown using the corrected harness — better than any allocation tested without the filter, and better than any portfolio using long-duration bonds as the defensive. Full sweep across portfolio compositions in the portfolio archetypes research note.
This is also why the SMA200 question matters in the first place. It is not a magic indicator that fixes leverage. It is a slow, simple trend filter that pairs particularly well with a heavy-defensive allocation because it routes the equity sleeve into the defensive during stress. On its own it does very little. Combined with the right base portfolio, it does a lot.
The harness is open
All the numbers in this piece come from a small Python module shipped today as an open-source library: sma200-bt on GitHub. It exposes one function (synthetic_letf_returns) and one helper (fetch_tbill_rate) for the daily T-bill series. Six pytest cases pin the formula behavior across simple-mode parity, high-rate borrow drag, zero-rate parity, inverse leverage, Series alignment, and the compound helper.
Install:
pip install sma200-bt
Anyone who wants to verify the numbers in this article can run the calibration themselves in about 10 lines of code (the README walks through it). Everything is reproducible end-to-end from public data via yfinance.
If you have been citing simple-formula synthetic LETF numbers anywhere, including from the Reddit thread linked above, those numbers are wrong by a meaningful margin. The corrected numbers are not as flashy, but they hold up under scrutiny and they tell a more useful story about what the SMA200 trend filter is actually good for.
Related reading
- SMA200 vs buy-and-hold: 16 years of data on the simplest trend filter — the original case for why the SMA200 filter is worth the trouble at all
- Why one indicator isn't enough (and why three tuned indicators aren't better) — what the walk-forward data says about stacking RSI/MACD/Bollinger on top of SMA200, and the portfolio-construction angle that actually moves the needle
Source research
This article synthesizes findings from:
- Borrow-Cost Correction: Synthetic LETF Methodology + Revised Numbers — the full methodology note, including the SOXL and DBMF numbers not shown here
- Defensive Bucket Comparison — why long bonds don't defend and gold does
- Portfolio Archetypes Search — full sweep of UPRO/UGL ratios and the filter's lift per composition
Every number is reproducible via pip install sma200-bt. Or check the live SMA200 status of the underlyings discussed here — QQQ, SPY, TQQQ, UPRO, UGL.
For the broker side of executing trend-filtered leveraged positions, see the broker shortlist.
What's next
Now live: The Third Defensive Bucket: Managed Futures as an Alternative to Cash and Gold walks through DBMF as the third option alongside cash and gold. 7-year data shows it delivers the best single-asset max drawdown protection and pairs well with gold for a 50/50 defensive sleeve.