The Semi Collapse Scenario: What the SMA200 Actually Does to TQQQ and SOXL if Semis Have Their Own Dotcom
Semi stocks are six years into a runaway bull. The Philadelphia Semiconductor Index is up roughly 4× since 2020. SOXL, the 3× leveraged version, is up roughly 30× off its 2022 low. NVDA is the most valuable company on earth. Almost every retail trader holding TQQQ or SOXL right now has the same quiet escape plan: "I'll just use the SMA200 to bail if it cracks."
I want to take that assumption seriously. The last time we had a tech bubble of comparable shape was the late 1990s. Synthetic backtests with proper borrow-cost modeling let us run the SMA200 escape plan against that actual collapse, plus the GFC, plus 2022, plus the COVID flash crash. So the question isn't theoretical: if semis have their own dotcom-style ending, what does the SMA200 escape plan actually do for your TQQQ and SOXL position?
The short answer: it works for UPRO (3× SPY) and it does not work for the other two. The filter is real, but it does not rescue leveraged ETFs whose underlying has tail-vol the size of QQQ or SOX in a bubble pop.
The setup
Three synthetic 3× ETFs, all built using the same Testfolio-compatible formula with daily borrow cost on the leveraged exposure. Same filter rule across all three: long the synthetic LETF when its underlying closes above its 200-day SMA, otherwise cash. Same transaction cost (1bp per side). Same window: 1999-03-10 through 2026-05-15 (27.2 years).
Underlying choices:
- Synthetic UPRO — 3× SPY, expense ratio 0.91%
- Synthetic TQQQ — 3× QQQ, expense ratio 0.86%
- Synthetic SOXL — 3× ^SOX (Philadelphia Semiconductor Index, the underlying SOXL tracks), expense ratio 0.95%
All three with the SMA200 filter applied. Full borrow modeling so this matches what the actual funds would have done if they had existed in 2000.
The data
| Strategy (1999-2026, with SMA200 filter + borrow cost) | CAGR | Max DD | Sharpe | $1 → |
|---|---|---|---|---|
| Synthetic UPRO + SMA200 | 11.43% | -67.21% | 0.491 | $19.0 |
| Synthetic TQQQ + SMA200 | 11.22% | -95.40% | 0.465 | $18.0 |
| Synthetic SOXL + SMA200 | 5.91% | -99.13% | 0.437 | $4.8 |
CAGR is similar for UPRO and TQQQ. The story is in the drawdowns.
UPRO with the filter holds up. A -67% drawdown on a 3× leveraged equity position is brutal but survivable for a disciplined holder. Most importantly, the equity curve recovers and continues compounding afterward.
TQQQ with the filter does not hold up. -95% drawdown means you lose 19 out of every 20 dollars. Most accounts don't survive that. Most humans don't either; even ones who say they would.
SOXL with the filter is essentially destroyed. -99.13%. The filter fires, the strategy goes to cash, the underlying continues collapsing with multiple false recoveries that drag the filter back into losing positions, and by 2002 the wealth multiple is one-hundredth of where it started. It doesn't recover meaningfully. The cumulative 27-year CAGR is 5.91% — worse than buy-and-hold SPY over the same window.
Here is the chart, log scale so the dotcom and GFC eras don't compress beyond recognition:
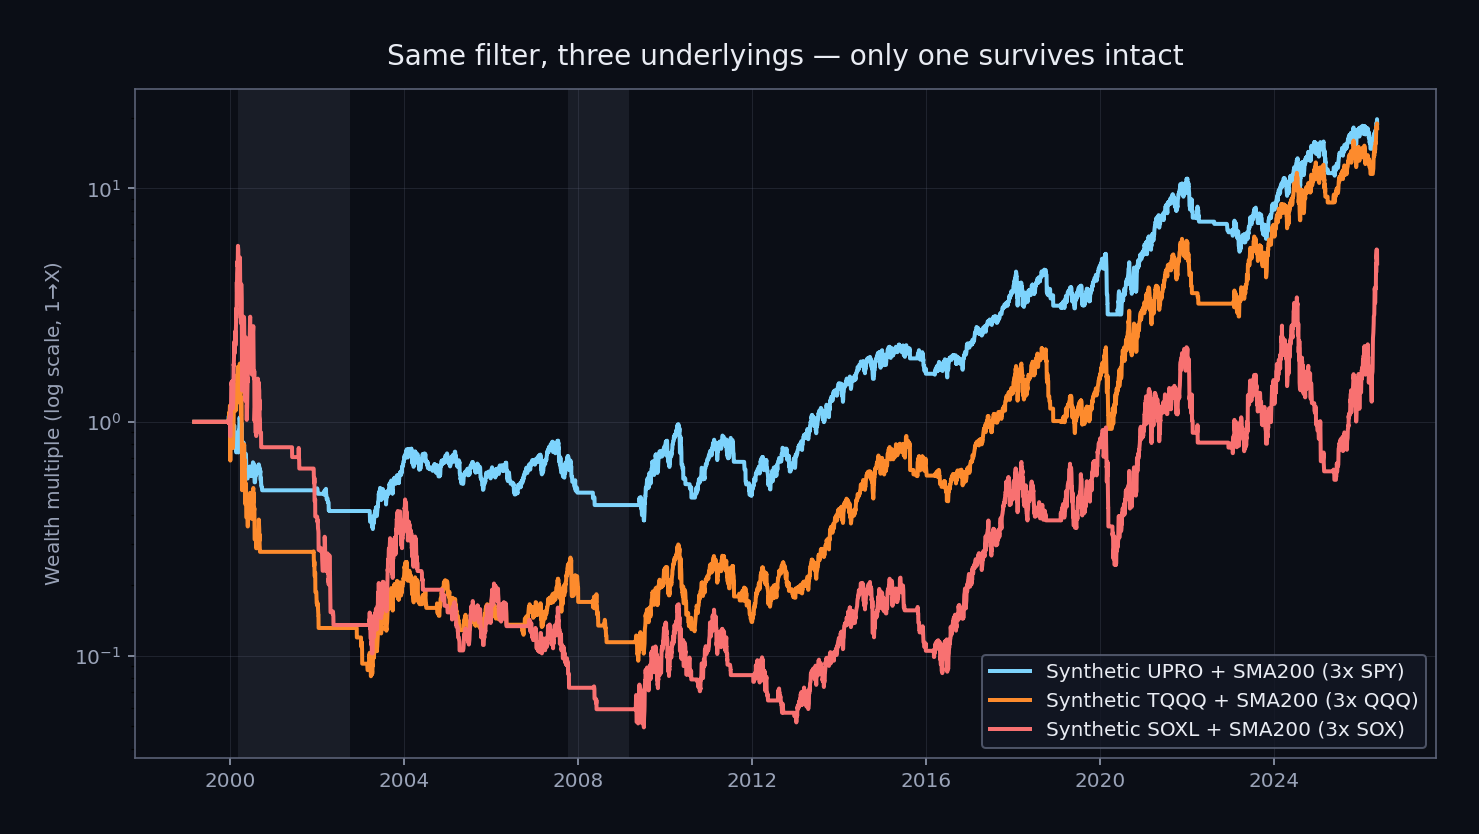
The red line is what happens when you apply the SMA200 to a leveraged ETF whose underlying has historical drawdowns deep enough that the filter's lag can't save you.
Why the filter breaks on SOXL specifically
The SMA200 filter is not magic. It is a slow lagging signal. When the underlying crosses below its 200-day moving average, that crossing happens at roughly 15 to 25 percent off the underlying's high. The 200-day MA is, by construction, an average of the prior 200 trading days. In a strong bull run the MA sits well below the current price, so price has to fall substantially before crossing below.
On 3× leverage, that 15 to 25 percent underlying drop becomes a 45 to 65 percent drop in the leveraged version before the filter even exits. The filter then puts you in cash, which protects you from further losses. But the damage is already done from peak.
For UPRO, SPY's worst dotcom drawdown was about -50%. The leveraged version was already deep underwater by the time the filter fired, but SPY's drawdown was shallow enough that the strategy could survive and recover.
For TQQQ, QQQ's dotcom drawdown was -83%. The leveraged version compounds losses faster than the underlying, and the recovery is brutal because every gain has to compensate for the borrow cost during long periods. The filter exits, but by the time the dust settles in 2002, the synthetic TQQQ is at roughly $0.10 against its early-2000 peak of about $2. A -95% strategy drawdown.
For synthetic SOXL, ^SOX's dotcom drawdown was about -85%, plus the semiconductor sector had multiple violent rallies during the bear that triggered the filter to re-enter long, take another leveraged hit, and exit again. Each whipsaw cycle stacks losses. Combine that with ^SOX's structural volatility (~37% annualized vs SPY's 19%) and the result is a strategy that effectively cannot survive a dotcom-style ending.
This is the vol break-point finding from the research notes: 3× leverage breaks above approximately 25-30% underlying volatility, filter or no filter. SPY at 19% vol handles it. QQQ at 27% handles it poorly. ^SOX at 37% is destroyed by it.
The underlying matters more than the leverage
The reflexive read of this data is "use less leverage" — pick QLD (2× QQQ) instead of TQQQ, or pick lower leverage on semis. That helps somewhat, but not as much as you'd think. The bigger lever is the underlying choice, not the leverage level.
A Reddit thread last week walked through exactly this. 2× QQQ (QLD) over the same 1999-2026 window with the SMA200 filter ends at -85% max drawdown. Still catastrophic, not as bad as TQQQ. Meanwhile 3× SPY (UPRO) at -67% beats 2× QQQ at -85% — higher leverage on a tamer underlying beats lower leverage on a wilder one.
The intuition that "use less leverage to reduce drawdown" is right in isolation but wrong as a comparison tool across different underlyings. The underlying's bear-market drawdown profile matters more than how much leverage you stack on it.
For trend-filtered leveraged equity that survives dotcom-style regimes, the actionable framework is:
- Pick the underlying first based on how rough its historical bear markets are and how much path-pain you can absorb
- Then size leverage to your stomach
SPY tolerates 3× with the SMA200 filter. QQQ tolerates 3× weakly; 2× more comfortably. SOX-based 3× (SOXL) doesn't really tolerate any leverage with the filter alone — you need additional risk management on top.
What this means if you're currently in TQQQ or SOXL
This article is not a prediction. Semis might keep running for years. I have no idea. What I can tell you is that the SMA200-only escape plan that's common in retail leveraged-ETF communities is much less protective than its advocates believe, if the underlying ends up having a multi-year crawl with whipsaws.
Three practical reads:
1. The filter alone is not sufficient risk management on a high-vol leveraged ETF. It is a slow drawdown-reducer that works well on lower-vol underlyings (SPY) and poorly on higher-vol ones (QQQ, SOX). Sizing your position assuming "but I'll bail on the SMA cross" is meaningfully optimistic on TQQQ and meaningfully wrong on SOXL.
2. Portfolio construction matters more than the filter. The research on portfolio archetypes shows that pairing a leveraged-equity sleeve with a heavy gold allocation (33-50% UPRO + 50-67% UGL, with the filter applied to the equity sleeve) produces meaningfully better risk-adjusted returns than any pure leveraged-equity strategy, even with the filter. The filter is a portfolio tool, not a standalone strategy.
3. If you must hold leveraged equity through a potential bubble unwind, size the position to survive a strategy max drawdown like the ones above. For TQQQ + filter, that means assuming -95% is on the table. For SOXL + filter, -99%. Position size accordingly. The filter is not your insurance policy; it is a damage reducer.
The cleaner pattern for anyone running this kind of strategy: lower-vol underlying (SPY), 3× leverage (UPRO), SMA200 filter on the equity sleeve, defensive allocation in gold. Mix per your stomach. Skip ^SOX-based leveraged products if you don't have additional risk overlays. Their tail-vol is too extreme for the filter alone.
The takeaway
The SMA200 trend filter is a useful tool. It is not a magic safety net. Whether it saves your leveraged ETF position in a dotcom-style ending depends almost entirely on the underlying, not on whether you have the filter on. On SPY-based 3× leverage, it cuts a brutal -98% buy-and-hold drawdown to a survivable -67%. On QQQ-based 3× it cuts a -100% wipeout to a still-catastrophic -95%. On SOX-based 3× it doesn't meaningfully save you at all.
The cleaner framing: the filter is a slow lag-protected damage reducer. Not a safety net. Different thing.
If you're currently riding the semi bull through SOXL or TQQQ and your plan is "I'll use the SMA200," it's worth knowing that plan has a historical failure mode that's worse than most people assume. The plan is not wrong. It is incomplete.
Caveats worth naming
- This is not a market prediction. Semis might run for years. The data here describes what happened in 1999-2002 and what would happen if a similar regime repeated. The future is its own thing.
- Synthetic SOXL pre-2010 uses ^SOX as the underlying (the index SOXL tracks). Real SOXL launched in March 2010. The synthetic with proper borrow modeling matches real SOXL within 5% over the calibration window (2015-2024), so the longer extrapolation is defensible directionally, but absolute pre-2010 numbers are illustrative.
- Borrow cost modeled at ^IRX + 40bps. This matches Testfolio's approach and approximates ProShares' actual swap pricing. See the methodology article for why this matters.
- Backtests assume disciplined execution. Real-world execution (panic selling at the bottom, hesitation re-entering at the top, ignoring signals during whipsaws) makes the actual realized drawdowns worse than the backtest, not better.
- The dotcom era is one data point. The 2002-onward era and the GFC also stress the strategy, but the dotcom period is the headline. Future bears might be milder, faster, or different in shape.
Source research
This article synthesizes findings from:
- Borrow-Cost Correction: Synthetic LETF Methodology — the methodology foundation
- Leverage vs Volatility per Underlying — the vol break-point evidence (3× breaks above ~30% underlying vol)
- Full Leverage Spectrum — 1×/2×/3× across SPY/QQQ/^SOX showing where leverage stops helping
Reproducibility: all numbers from pip install sma200-bt.
Related articles
- The Hidden Cost Every Leveraged-ETF Backtest Ignores — the borrow-cost methodology that powers these synthetic numbers
- Does the 200-day Moving Average Actually Beat Buy-and-Hold? — the foundational case for the filter (and where it fails)
- Why One Indicator Isn't Enough — the walk-forward evidence that fancier indicator stacks don't help
Check current SMA200 status on the leveraged ETFs discussed: SOXL, TQQQ, UPRO. Underlyings: QQQ, SPY.
For the broker side of running trend-filtered leveraged positions or LEAPS as an alternative to leveraged ETFs, see the broker shortlist.